DURING THE AUSTRAL SUMMER of 1911-12, Roald Amundsen and Robert Falcon Scott led the first overland expeditions to reach the geographic South Pole. Imagine for a moment, what it must have been like to stand at the most southerly point on the globe for the first time. Nothing but sun, snow, wind and the satisfaction of being the first people to stand at this historic site. A far cry from the state-of-the-art-facility that now sits at the pole with daily flights, Internet connectivity, and a Frosty Boy that delivers soft serve ice cream 24/7. The snow that these heroic travelers strolled upon is currently buried some 15 meters below the surface. The air they breathed has long since vanished. Or has it?
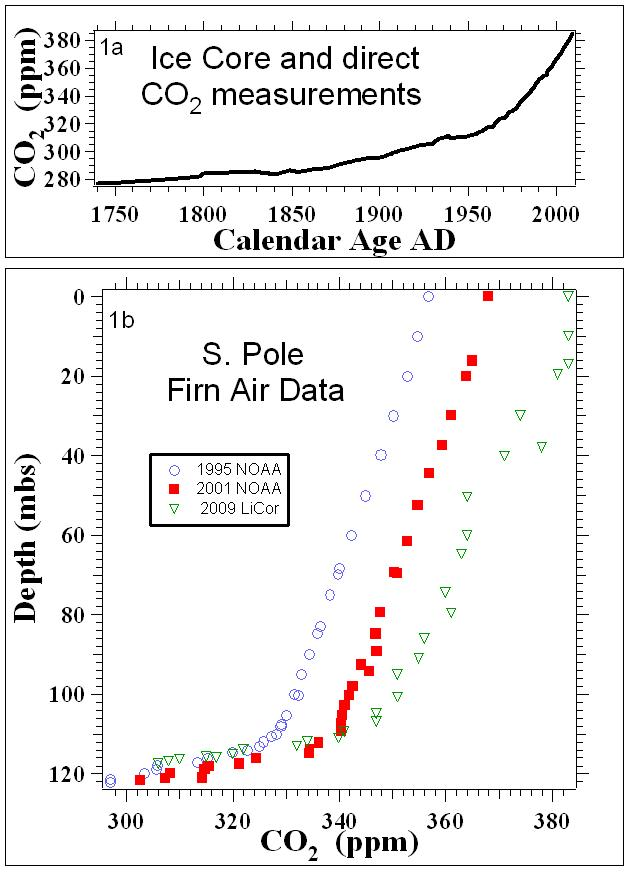
Today there is a clean air facility at South Pole (operated by NOAA/ ESRL) that has continuously monitored the composition of the atmosphere in this pristine setting since 1975. The instrumentation housed in the clean air facility has evolved considerably since its inception providing more accurate measurements of an ever-expanding suite of atmospheric constituents that are critical for assessing the degree to which man has altered the global atmosphere. One factor that limits the science of assessing the anthropogenic impact on the composition of the atmosphere is the lack of long-term records. For example, atmospheric carbon dioxide (CO2) measurements were initiated in 1956-7 as part of the International Geophysical Year (IGY). To reconstruct an atmospheric CO2 record prior to 1956 we've utilized measurements of trapped gases in ice cores, which are somewhat less accurate than direct atmospheric measurements. A composite CO2 record from the mid-18th century to present is illustrated in Figure 1a. It shows that CO2 levels have increased from ~280ppm to present day values of 384ppm (a 37% increase).
Anyone who has visited the top of an ice sheet knows that the surface is covered with snow, not ice. In the absence of surface melting, progressive snow accumulation increases the load on buried snow causing the density of the snow (more commonly referred to as firn) to increase with depth below the surface. Air in the upper few meters of firn directly below the surface is readily mixed throughout the open channels around the firn grains. As the density increases with depth, the open porosity decreases thereby limiting the ability of air to mix (via diffusion) with the overlying atmosphere. As a result, firn air ages with depth until it is locked into bubbles. The bubble close-off region is some 120 meters below the surface at South Pole. It turns out that the air right above the bubble close-off region at South Pole dates to the early part of the 20th century when Amundsen and Scott arrived at the South Pole for the first time. The air in the firn at South Pole retains a record of atmospheric compositional changes spanning the last century.
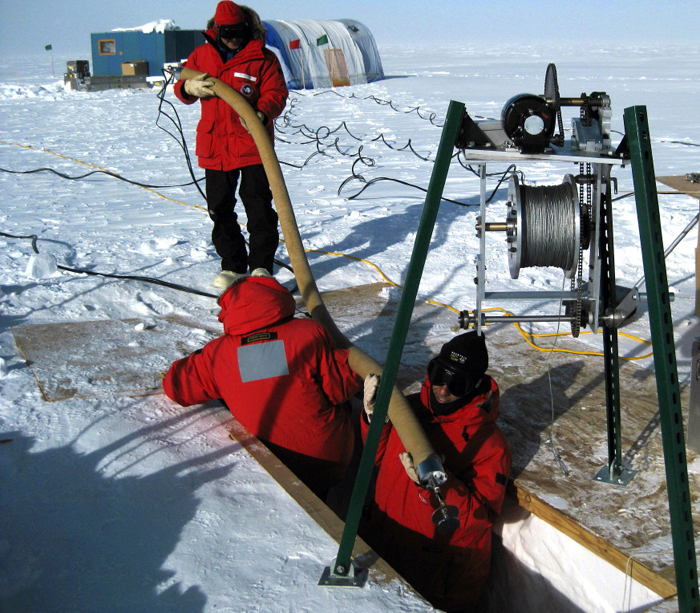
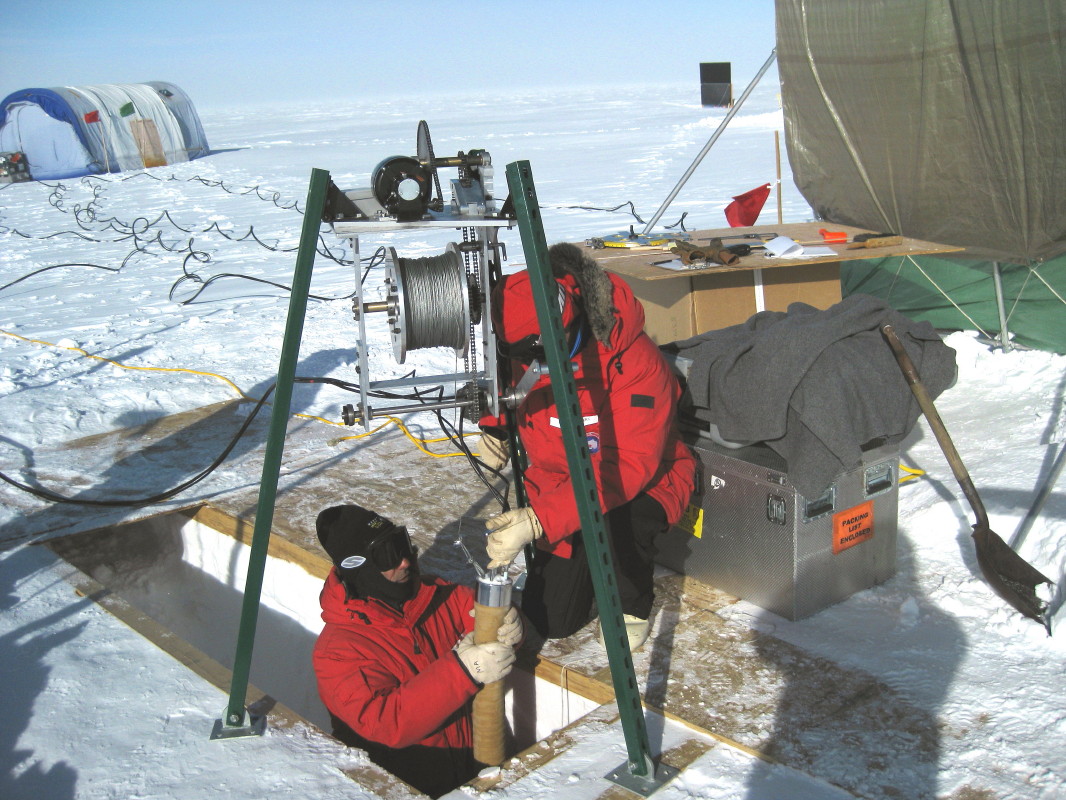
There have now been three summer expeditions to South Pole to sample firn air (1994-95, 2000-01 and 2008-09). During each sampling, electromechanical drills were used to incrementally drill holes to specified depths. A rubber bladder with air sampling lines was then lowered to the bottom of the hole and inflated to isolate the firn air at the bottom of the hole. Pristine firn air was then pumped from below the bladder to the surface and into glass/metal flasks that were subsequently analyzed for as many constituents as possible. The CO2 data from the three expeditions is plotted in Figure 1b (note the 2009 data from NOAA/ESRL are not available yet. The data plotted for 2009 are less accurate values from our on-site monitoring). In each case, the surface CO2 value agreed with the contemporaneous values measured by NOAA/ESRL from the clean air facility supporting the integrity of our sampling protocol. The CO2 data show a gradual decrease from surface to ~115m. Below 115 meters, CO2 values drop very quickly because the air in the few open pores remaining can no longer communicate with the overlying atmosphere. Here, firn air ages with depth based on the annual accumulation rate at South Pole (~6-8cm per year.) The CO2 values at the bottom of the South Pole firn holes range from 290 to 306ppm (Figure 1b) and correlate well with CO2 values from the Law Dome ice core dated between 1880 and 1920AD (Figure 1a).
The CO2 data provide the chronometer we need to determine the age of the air at each sampling depth and allow us to tune a firn air diffusivity model. The model is then used to reconstruct the composition of other atmospheric constituents that we measure in the flasks spanning the last century. For our most recent expedition (2008-09) we will measure the isotopic composition (13C/12C and D/H) of methane (CH4) in the returned flasks to reconstruct the atmospheric isotope variations over the last century. These isotope records provide independent means of assessing historical CH4 emission scenarios that involve a multitude of both natural and anthropogenic CH4 sources. Non-methane hydrocarbons (e.g. ethane, propane and butane) will provide clues to changes in the oxidative capacity of the atmosphere and can be useful in understanding the causes of variability in methane. Measurements of changes in the O2/N2 ratio of the air provide important information for constraining terrestrial (including anthropogenic) and marine sources and sinks of O2 and CO2 to the global atmosphere. These measurements are crucial for an improved understanding of the CO2 sources that have contributed to the CO2 buildup illustrated in Figure 1a. Measurements of several halogenated species will help us evaluate halogen transport to the stratosphere where they catalyze the destruction of ozone. We will also analyze for carbonyl sulfide (COS), which is the most abundant sulfur containing gas in the troposphere and contributes to formation of sulfate aerosols in the stratosphere.
It is very clear that Amundsen and Scott had plenty to think about as they stood at the geographic South Pole nearly a century ago. Nonetheless, one thing we can be sure they were not thinking about was the composition of the air that they were breathing. Efforts to recover and measure the composition of firn air from South Pole allow us to reconstruct the atmosphere during their arduous expeditions and identify important changes that have occurred since then.
Acknowledgments:
Firn air data would not be available without the help of the drillers. On the 2009 South Pole drilling team, we'd like to thank Mike Waszkiewicz and Bella Bergeron for their expert drilling services as part of Ice Coring and Drilling Services (ICDS). All the staff/support at South Pole along with the 109th ANG were essential for success during all three expeditions. Science support comes from the National Science Foundation, Office of Polar Programs.
Reference:
Etheridge, D. M., Steele, L. P., Langenfields, R. L., Francey, R. J., Barnola, J.-M., and Morgan, V. I. (1996). Natural and anthropogenic changes in atmospheric CO2 over the last 1,000 years from air in Antarctic ice and firn. Journal of Geophysical Research, 101, 4115-4128.